Bootstrap for alerting
This post is about some stuff I tweeted a few days ago. This is also a follow-up to my Bootstrapping Time Series post.
I would like to see time series bootstrapping used to implement some really awesome alerting features.https://t.co/5eqTLcSIjM
— preetam (@PreetamJinka) May 4, 2017
E.g. "alert me when the 95th percentile latency of this query is higher than expected with 99% confidence"
— preetam (@PreetamJinka) May 4, 2017
General form would be
— preetam (@PreetamJinka) May 4, 2017
Alert when F(metric) is {lower,higher} than expected with C% confidence.
F: sum, count, min, max, avg, etc.
C just determines which bucket you look at. pic.twitter.com/YtTzG619vu
— preetam (@PreetamJinka) May 4, 2017
I think this sort of approach is much more valuable for alerts than generic anomaly detection, which can get really complicated and hard to interpret. It’s really easy to implement too!
Bootstrap Go package
I created a tiny Go package called bootstrap as the foundation for this kind of system. You can take a look at its godoc too.
The package provides a Resampler type that samples with replacement from a slice of floats,
aggregates them with whatever aggregation function you choose, and saves the result. You can then
use a Quantile function to pick from the distribution of results.
Usage
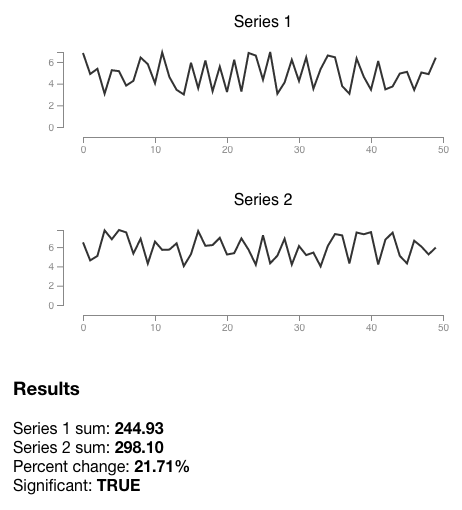
Here’s an example using the same test data set as my other post.
package main

import (
	"fmt"

	"github.com/Preetam/bootstrap"
)

func main() {
	// Create a Resampler
	resampler := bootstrap.NewResampler(bootstrap.SumAggregator{})

	// Resample and aggregate from series 1
	resampler.Resample([]float64{
		6.83, 4.89, 5.37, 3.07, 5.24, 5.15, 3.82, 4.26, 6.41, 5.80,
		4.04, 6.88, 4.61, 3.43, 3.00, 5.93, 3.58, 6.14, 3.30, 5.57,
		3.23, 6.20, 3.27, 6.83, 6.59, 4.36, 6.92, 3.07, 4.11, 6.20,
		4.24, 6.42, 3.53, 5.34, 6.60, 6.43, 3.77, 3.07, 6.32, 4.63,
		3.44, 6.08, 3.47, 3.74, 4.93, 5.09, 3.42, 5.03, 4.88, 6.40,
	}, 100)

	// Aggregate the sum from series 2
	sum := bootstrap.SumAggregator{}.Aggregate([]float64{
		6.49, 4.62, 5.08, 7.73, 6.81, 7.77, 7.52, 5.33, 6.86, 4.29,
		6.57, 5.71, 5.74, 6.39, 4.03, 5.27, 7.66, 6.13, 6.21, 6.96,
		5.23, 5.37, 6.90, 5.72, 4.17, 7.22, 4.32, 5.11, 6.86, 4.19,
		6.11, 5.17, 5.43, 4.00, 6.11, 7.35, 7.21, 4.31, 7.51, 7.33,
		7.55, 4.19, 6.77, 7.50, 5.09, 4.31, 6.66, 6.05, 5.24, 5.95,
	})

	// Calculate some threshold value based on series 1
	threshold := resampler.Quantile(0.95)

	// Check if the series 2 aggregate is higher than the threshold
	if sum > threshold {
		fmt.Printf(
			"Sum of series (%0.2f)"+
				" higher than expected (%0.2f) with 95%% confidence.\n",
			sum, threshold)
	}

	fmt.Println("\nQuantiles:")
	for _, q := range []float64{0.25, 0.5, 0.75, 0.9, 0.95, 1.0} {
		fmt.Printf("%0.2f = %0.2f\n", q, resampler.Quantile(q))
	}
}
Sum of series (298.10) higher than expected (257.03) with 95% confidence.

Quantiles:
0.25 = 236.33
0.50 = 243.59
0.75 = 251.22
0.90 = 255.86
0.95 = 257.03
1.00 = 271.45
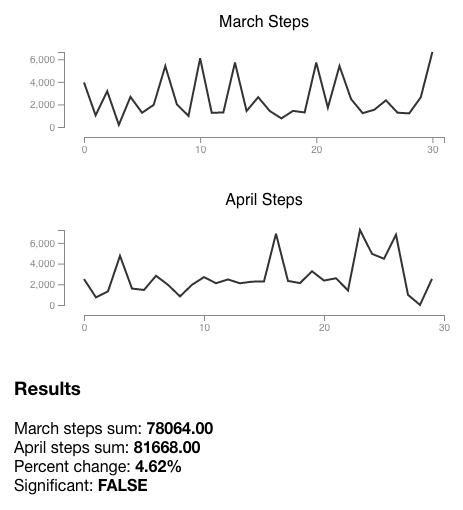
Step counts
Test data can be boring, so let’s check my FitBit step counts from March and April to see if I’m walking more than usual.
Quantiles:
0.25 = 71938.00
0.50 = 79288.00
0.75 = 85032.00
0.90 = 92892.00
0.95 = 96056.00
1.00 = 124088.00
I had more steps, but the change isn’t significant enough to alert me. I should walk and run more :D.