Thoughts on Back Pressure
I watched the “Arista Networks 7500 Series Architecture” video again last night. I’ve embedded it below.
I think that was at least the third time I’ve seen that video. Even if you’re not a networking nerd, I suggest that you watch it at least once.
Packet Buffers
Most of the video is about packet buffers. Specifically, it’s about big buffers vs small buffers in switches. Switches have packet buffers to sustain bursts. If a switch’s buffers fill up, it’ll start dropping packets. There’s nothing else it can do.
Dropped packets are a scenario we can tolerate. Protocols like TCP have mechanisms to detect and work around dropped packets. An application running on top of TCP doesn’t really see this dropping and retransmission happen. All it sees is network I/O getting slower. Back pressure.
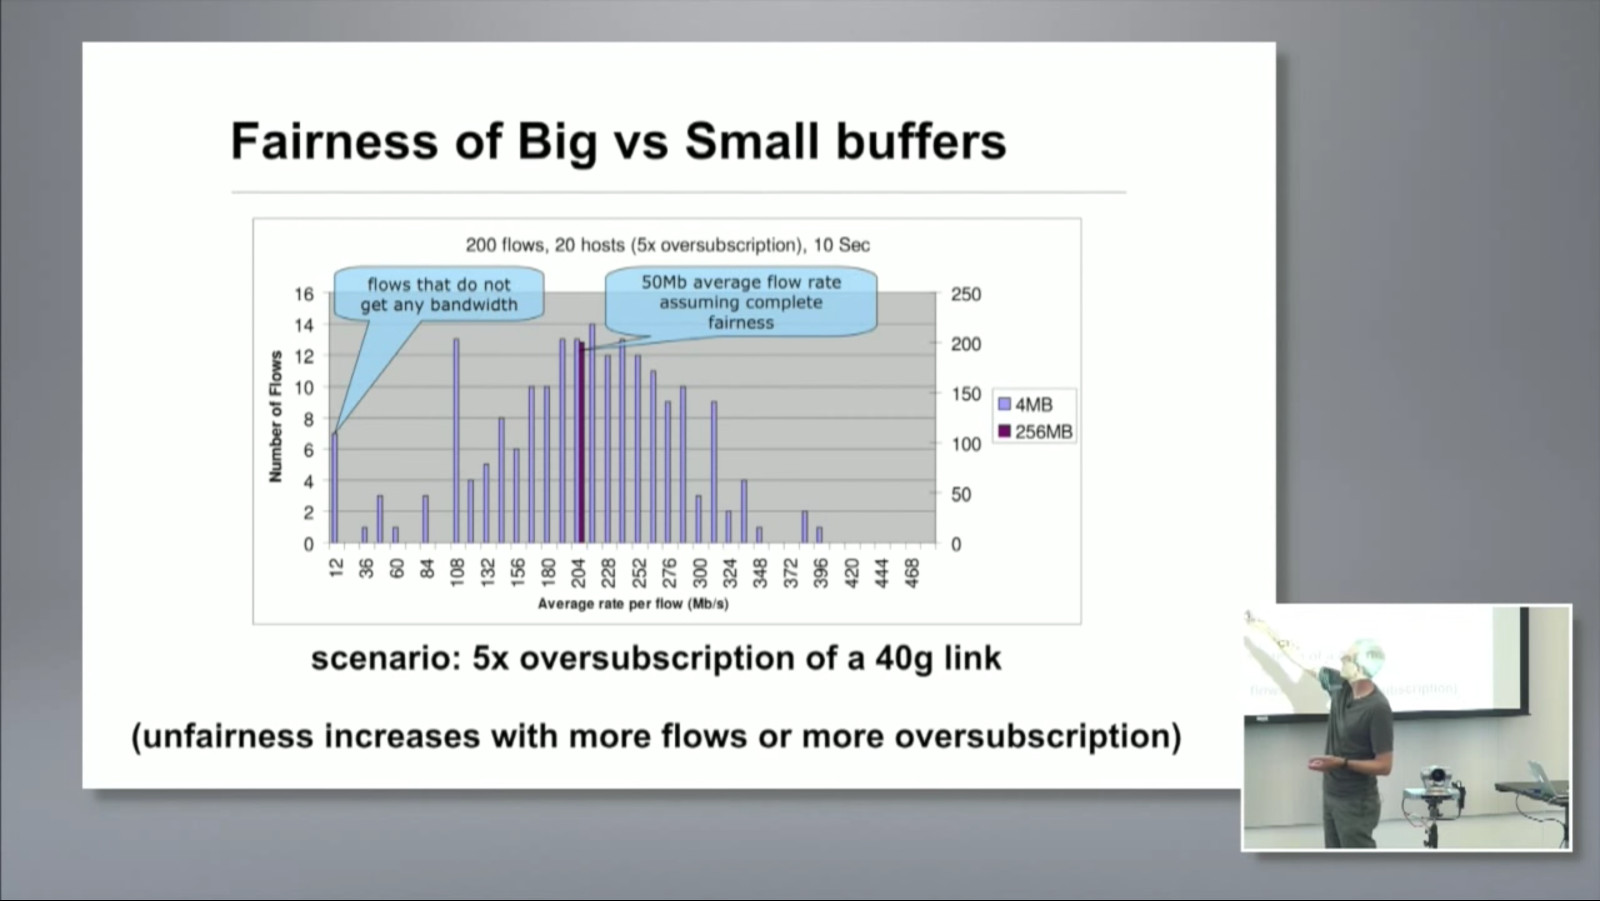
There’s an important slide that comes up at around 20:00. It’s about the distribution of bandwidth across flows. A flow is a single TCP connection. The slide shows the comparison of small buffers vs large buffers on bandwidth distribution fairness across flows.
With large buffers, the distribution is extremely tight. All of the flows receive equal bandwidth. With small buffers, there’s a huge range. Some flows receive much more bandwidth than others.
That unfairness can have a huge effect on applications higher up the stack. Applications generally don’t depend on a single TCP flow, and performance usually is limited by the slowest flow.
Beyond TCP flows
The same sort of thing happens with web pages or database queries. If you have a page with 10 elements, and you need all 10 to make the page usable for an user, your response time depends on the slowest-loading element. If you have a page that requires 10 queries to run before rendering, its response time depends mostly on the slowest query.
Where to have back pressure
It seems like having back pressure at lower levels of the stack is really unfavorable. One layer above the point of back pressure will probably have really wide distributions, and every layer above that gets worse and worse.
It’s much harder to manage back pressure at lower levels of the stack. Take switches, for example. You can do much to avoid packet loss unless you increase capacity or increase buffering. You’re dealing with hardware at that point, so this can be really expensive or complicated. You may not even be able to control that.
It’s also much more difficult to monitor back pressure at lower levels of the stack. Take memory pressure, for example. Garbage collected languages may have GC metrics, but what about the OS? What if you don’t have access to those metrics?
Faults
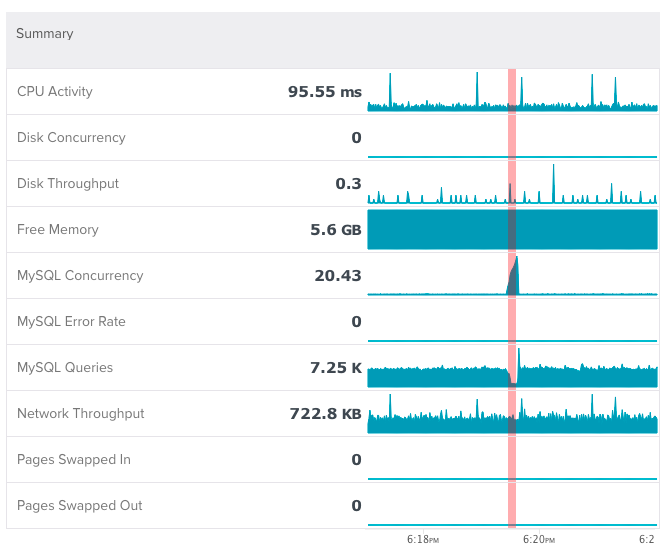
I see back pressure all the time at work. We have a feature that detects stalls in databases. A stall is a short (on the order of seconds) period of time when there is lots of work in progress and not enough work being completed. One side effect of a stall is query latencies going through the roof.
Here’s one example. MySQL concurrency (queries in progress) gets really high and MySQL Queries (queries completed per second) drops really low.
That’s a clear example of back pressure at the database. What can / should your application do in that scenario?
Detecting back pressure
At work, we have Adaptive Fault Detection that detects stalls. It doesn’t detect back pressure in general. I’d say stalls make up a subset of back pressure scenarios. Now, I’m thinking about what the rest look like, what the relevant metrics are, and how to detect them.


